First read: about 5 minutes. Lecture 1: Introduction to data science.
Sport and health produce more data every year: GPS vests on football players, heart-rate watches on runners, match video, medical records. None of it helps a coach or a physiotherapist on its own. Data science is the craft of turning those raw records into understanding and, in the end, into a better decision, such as which player to rest or which training plan to pick.
This first lecture lays the foundation for the whole course. It explains what data science is (a mix of three skill sets), what kinds of data exist, how data science differs from classic statistics, and the fixed series of steps every project follows, called the data science lifecycle. Your group assignments follow those same steps. The lecture also covers how the course is organised; that part is admin, not exam content.
The ideas to keep
Blur the explanations and test yourself.
Data science. A field that uses scientific methods, processes, algorithms (step-by-step recipes a computer follows) and systems to pull knowledge and insight out of data. It is more than fitting a model (a formula that links inputs to an output). Blei & Smyth (2017) add that you must understand where the data came from, handle private data responsibly, and say clearly what a dataset can and cannot tell you.
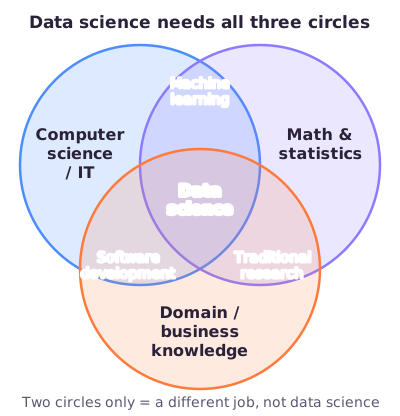
Three disciplines. Data science sits where three skill sets overlap: computer science/IT (programming, handling data), math and statistics (telling real patterns from chance), and domain knowledge (knowing the sport or health problem itself). Any two without the third gets a different name: computer science + statistics = machine learning (computers learning rules from data); computer science + domain knowledge = software development; statistics + domain knowledge = traditional research.
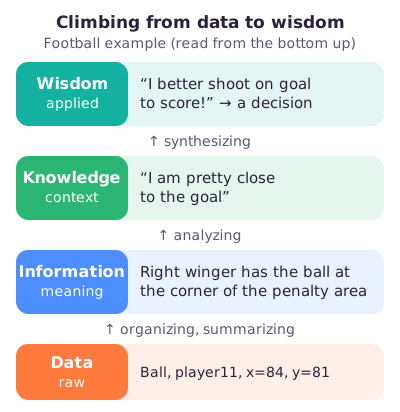
From data to wisdom. Raw data ("Ball, player11, x=84, y=81") become information once organised and given meaning ("the right winger has the ball at the corner of the penalty area"). Information becomes knowledge once understood in context ("I am pretty close to the goal"). Knowledge becomes wisdom once applied to a decision ("I better shoot on goal to score!"). Each step up needs interpretation, not just more numbers.
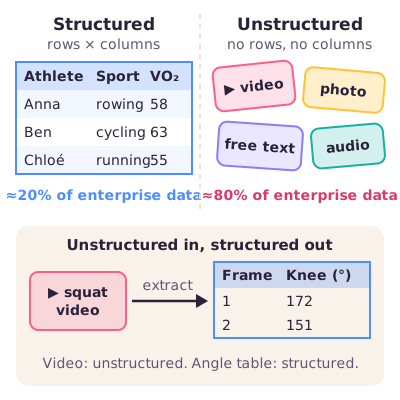
Structured vs unstructured data. Structured data fit neatly in rows and columns, like a table of athletes and their VO₂max (maximal oxygen uptake). Unstructured data do not: video, images, audio, free text, e-mails. An estimated 80% of company data is unstructured, and less than 1% of it is analysed. A separate question is quantitative (amounts, like jump height) versus qualitative (categories, like sport or injury type).
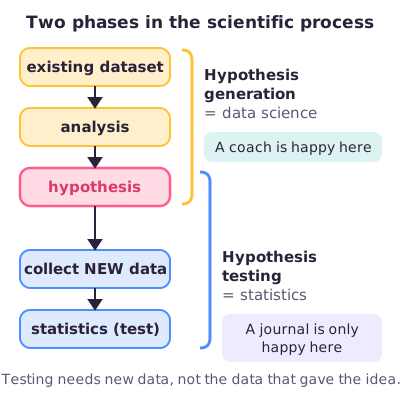
Data science vs statistics. Both try to get knowledge out of data. Statistics usually starts from a hypothesis (a testable claim), tests it, and works well with few data points. Data science usually starts from a large existing dataset and explores it to come up with hypotheses. A coach may already be happy with a pattern found that way. A scientific journal is only happy once it has been tested on new data.
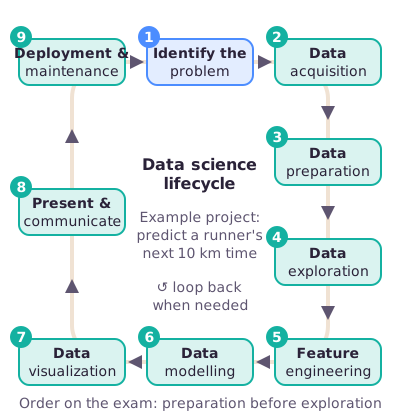
The lifecycle. Every project runs through nine steps in a loop: identify the problem → data acquisition (getting the data) → data preparation (cleaning it) → data exploration (first summaries and plots) → feature engineering (building useful input variables) → data modelling (fitting the model) → data visualization (charts of data and results) → present and communicate → deployment and maintenance (putting the result to use and keeping it working). You can loop back to an earlier step at any time.
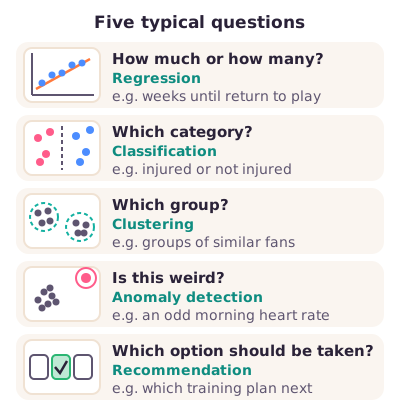
Start with the question. Step 1 decides everything else. Understand the real problem, talk to domain experts, keep asking "why?", and name the target variable (the thing you want to predict or explain). Five typical questions each point to an approach: how much or how many? → regression; which category? → classification; which group? → clustering; is this weird? → anomaly detection; which option should be taken? → recommendation.
What to be able to do
Name the three disciplines of data science and what each two-circle overlap is called (machine learning, software development, traditional research).
Place a statement on the data → information → knowledge → wisdom ladder, for example "I am pretty close to the goal" = knowledge.
Classify a data source as structured or unstructured (a walking video or ultrasound scan = unstructured; a VO₂max value or a diagnosis category = structured), and as quantitative or qualitative.
List the nine lifecycle steps in order (preparation comes before exploration) and place an activity in its step. For example, in R (the course's programming language), running str() to see how a dataset is built = data exploration; drawing a chart with ggplot() = data visualization.
Match a practitioner's question to regression, classification, clustering, anomaly detection or recommendation.
Contrast data science and statistics, including hypothesis generation vs hypothesis testing and "coach happy vs journal happy".
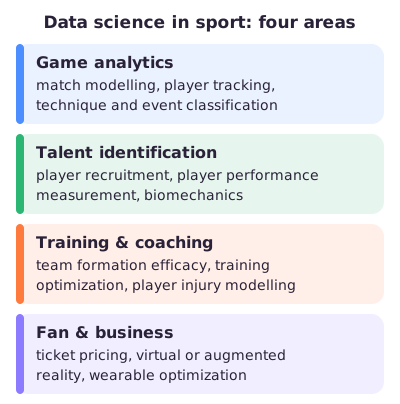
Name the four areas of data science in sport (game analytics, talent identification, training & coaching, fan & business) with an example of each.
Give R's advantages and disadvantages, and name the four panes of RStudio (the program you write R code in).
Next step
Read the deep dive for full explanations, diagrams and worked examples. Then try the practice questions before opening the answers. The full slides are here for offline use.
Got the big picture?Mark the overview done to fill this lecture's ring.
2Step 2 of 312–18 min
Detailed notes
This deep dive teaches everything in Lecture 1 from zero, so you do not need the slides next to you. It covers what data science is, the climb from raw data to a wise decision, the kinds of data, where data science is used in sport, how it relates to statistics and to machine learning (computers learning rules from data), the nine steps every project follows (the data science lifecycle), and the R programming tools. Course admin is collected in its own clearly marked section near the end. Examples marked Illustration are invented to explain a concept; everything else comes from the slides or the two papers the slides quote. There is no recording for this lecture. The Canvas lecture page was checked on 11 October 2026, 11:40 CEST.
Picture yourself as the sports scientist at a football club. Every player wears a GPS vest in training, every match is filmed, the physio types notes after each treatment, and players log their sleep in an app. You are drowning in numbers. The head coach asks one simple thing: "Who should I rest on Saturday?"
Getting from that pile of numbers to a useful answer is what data science is about. You need three kinds of skill at once. You need computer skills to read and combine millions of rows. You need statistics to tell a real pattern from chance. And you need sport knowledge to ask a sensible question and to read the result correctly.
The lecture builds this up in order. First it defines data science and its three ingredients. Then it shows how raw data climb a ladder to information, knowledge and finally a wise decision. Next it sorts data into kinds: neatly laid out in rows and columns (structured) or not (unstructured), and amounts or categories. It also shows where data science is used in sport. It then contrasts data science with classic statistics. Finally it introduces the data science lifecycle: nine steps every project follows, from "what is the problem?" to "keep the tool working". The rest of the course, and your group assignments, walk through these nine steps one by one.
Key terms
Terms are listed in the order you need them, so each one only uses words defined above it.
Data. Recorded observations before anyone interprets them. Example: "Ball, player11, x=84, y=81".
Variable. One measured property that can differ between cases. Example: jump height, sport, or age.
Domain knowledge. Expert understanding of the field the data come from: the sport, physiology or medicine. Example: knowing that 220 heartbeats per minute during an easy jog is more likely a sensor glitch than a real value.
Algorithm. A fixed step-by-step recipe that a computer follows. Example: "sort players by distance run and list the top five".
Model. A simplified formula or rule that links inputs to an output, used to explain or predict. Example: a rule that predicts 10 km race time from weekly running distance.
Noise. Random variation that makes numbers bounce around without a real cause behind it. Example: your sprint time differs by 0.05 s between two equally good runs.
Statistics. The science of learning from data while handling uncertainty: is a pattern real, or just noise? Example: testing whether two training groups really differ in VO₂max.
VO₂max. Maximal oxygen uptake, a standard measure of aerobic fitness, in ml of oxygen per kg body mass per minute. Example: 58 ml/kg/min.
Computer science / IT. Programming and handling data with computers (IT = information technology). Example: code that reads 10 million GPS rows.
Hypothesis. A specific claim that can be tested with data. Example: "players who sleep under 7 hours recover more slowly".
Artificial intelligence (AI). The broad field of making computers do tasks that seem to need intelligence. Example: software that recognises each player in match video.
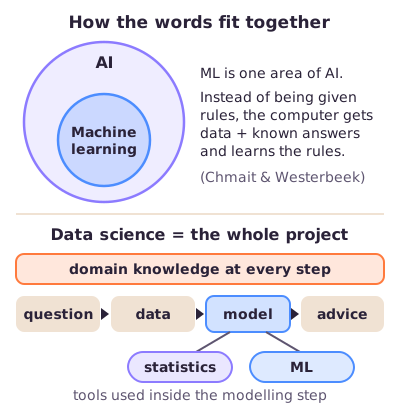
Machine learning (ML). One area of AI: instead of being given the rules, an algorithm gets data (often with the known answers) and learns the rules itself. Example: learning from past seasons which training loads came before injuries.
Supervised learning. Machine learning where the training data (the past cases it learns from) contain the known answer (the label) for each case. Example: past players labelled "injured" or "not injured".
Unsupervised learning. Machine learning without known answers; the algorithm looks for structure such as groups. Example: sorting fans into groups by age and postcode.
Database / relational database. An organised store of data; a relational database keeps it in linked tables of rows and columns. Example: one table of players, one of matches, linked by player number.
Information. Data that have been organised and given meaning. Example: "the right winger has the ball at the corner of the penalty area".
Knowledge. Information that has been understood in context. Example: "I am pretty close to the goal".
Wisdom. Knowledge applied to make an informed decision. Example: "I better shoot on goal to score!".
KDD (knowledge discovery in databases). The name for the process of getting from raw data to useful knowledge; the data-to-wisdom pyramid comes from this tradition. Example: GPS logs → "she slows down after 70 minutes".
Structured data. Data that fit a fixed layout of rows and columns. Example: a table with one row per athlete and columns for age, sport and VO₂max.
Unstructured data. Data without that fixed row-and-column layout. Example: match video, photos, audio, free-text physio notes, e-mails.
Data model. The fixed plan saying which fields a dataset has and what type each one is. Structured data have one; unstructured data do not. Example: "column 1 = name (text), column 2 = age (whole number)".
Data science. A multidisciplinary field that uses scientific methods, processes, algorithms and systems to extract knowledge and insights from structured and unstructured data. Example: the whole project from "who should rest?" to a tool the coach uses each week.
Enterprise data. All the data an organisation stores. Example: a club's ticketing, medical and tracking records together.
Long and wide data. "Long" = many rows (observations); "wide" = many columns (variables). Example: 3 seasons of daily records (long) with 200 measures each (wide).
Feature. An input variable that a model uses, often calculated from raw data. Example: average weekly distance over the last 6 weeks.
Quantitative data. Data that are amounts. Example: 38 cm jump height.
Qualitative data. Data that are categories. Example: judo, rowing, hockey.
Measurement scale. How much meaning the values carry: nominal (named categories, no order), ordinal (ordered categories), interval (equal steps, but zero is just a chosen point), ratio (equal steps and a true zero). Example: sport, medal, °C, cm.
Hypothesis generation. Exploring existing data to come up with a hypothesis. Example: spotting that short sleepers seem to recover worse.
Hypothesis testing. Checking a stated hypothesis with a planned analysis, ideally on new data. Example: a new study comparing recovery after short and long sleep.
Data mining. Searching large datasets for patterns; the lecture links it to hypothesis generation. Example: scanning 3 seasons of data for anything linked to hamstring injuries.
Data science lifecycle. The nine steps of a data science project, drawn as a loop: identify the problem, data acquisition, data preparation, data exploration, feature engineering, data modelling, data visualization, present & communicate, deployment & maintenance. Each step is explained in section 6.
Exploratory data analysis. Another name for data exploration: first summaries and plots to get to know a dataset. Example: a histogram of all players' sprint speeds.
Deployment. Putting a finished model or tool into real use. Example: the coach gets a weekly risk list in an app.
Target variable. The outcome you want to predict or explain. Example: next 10 km race time in seconds.
Regression. An approach that predicts a number ("how much or how many?"). Example: weeks until return to play.
Classification. An approach that predicts a category ("which category?"). Example: injured or not injured.
Clustering. An approach that finds groups of similar cases without known labels ("which group?"). Example: groups of similar fans.
Anomaly detection. Spotting a value that does not fit the usual pattern ("is this weird?"). Example: a morning heart rate far above normal.
Recommendation. Suggesting which option to take ("which option should be taken?"). Example: which of three training plans fits this athlete.
Player tracking / event classification / injury modelling. Following each player's position over time; labelling match events (pass, shot, tackle); estimating who is at risk of injury. Example: GPS positions every 0.1 s.
Biomechanics. The mechanics of human movement: forces, joint angles, speeds. Example: knee angle during a squat.
Golden Circle. A three-ring model: WHY (purpose) in the centre, then HOW, then WHAT. Example: "why does the club want this tool?" before "what will it show?".
R. A free programming language and environment built for statistics and graphics; the course's main tool. Example:mean(c(1.82, 1.75, 1.90)).
Package. An add-on bundle of ready-made R commands (called functions). Example:ggplot2 for charts.
Console. The window where you type a command and immediately see the result. Example: type 2 + 2, get [1] 4.
RStudio / IDE. RStudio is an IDE (integrated development environment): one program that bundles a code editor, the R console and helper panes. Example: writing a script in one pane and seeing its plot in another.
SQL. A language for asking questions of databases. Example: "select all players older than 30".
Python. Another popular programming language for data science. Example: the language most often asked for in data scientist job adverts.
Generative AI. Tools such as ChatGPT or Copilot that write text or code on request. Example: asking it why your R code gives an error.
1. What data science is
Plain definition. The lecture's definition (from Dhar, 2013, and Leek, 2013) is: data science is a multi-disciplinary field that uses scientific methods, processes, algorithms and systems to extract knowledge and insights from structured and unstructured data. In plain words: you use careful methods and computer power to pull something useful out of all kinds of data.
Why it matters. It tells you what the job really is. Fitting a model is only one small part. Blei & Smyth (2017), in a paper called "Science and data science", say data science combines three perspectives (statistical, computational and human). The lecture quotes their conclusion:
Data science is more than the combination of statistics and computer science … [it] requires that we understand the context of data, appreciate the responsibilities involved using private and public data and clearly communicate what a dataset can and cannot tell us about the world.
So besides statistics and computing, three extra duties are named: understand the context of the data, take responsibility for private and public data, and communicate clearly what the data can and cannot say.
The three disciplines (Venn diagram). The lecture draws data science as the centre of three overlapping circles.
Figure: Each pair of circles has its own name; only the overlap of all three is data science.
Circles combined
Name on the slide
What it lacks
Computer science + math/statistics
Machine learning
Domain knowledge
Computer science + domain knowledge
Software development
Statistics
Math/statistics + domain knowledge
Traditional research
Computer science
All three
Data science
Nothing
The same slide carries a well-known quip: "A data scientist is someone who is better at statistics than any software engineer and better at software engineering than any statistician."
Illustration: a runner's watch records heart rate every second. Programming pulls out the readings and lines them up with each training session. Statistics summarises how the readings change across weeks of training. Physiology (domain knowledge) tells you that a sudden jump to 220 beats per minute during an easy jog is probably the sensor slipping, not the heart. Drop any one of the three and the analysis goes wrong. A technically perfect analysis can still answer the wrong question if nobody understands the sport.
Analogy: think of a triathlon. Being world-class at swimming and cycling does not win the race if you cannot run. Data science needs all three legs.
Where the job came from. The lecture shows that Davenport & Patil (2012) called data scientist "the sexiest job of the 21st century". The slide lists three eras of in-demand number people:
1980–1990: Wall Street "quants" (quantitative analysts who used maths to trade).
1990–2000: computer engineers.
21st century: data scientists, who combine a scientific background, computational skills and analytical skills.
Job-advert charts (Hale, using data from Kaggle, a data science website) show the field's growth. LinkedIn had the most data scientist listings, followed by Indeed, SimplyHired, Monster and AngelList. The most requested general skills were led by analysis, machine learning, statistics, computer science and communication. The most requested technology skills were Python, then R, then SQL (a language for querying databases). The slide's conclusion: "Python or R is a must for virtually every data scientist position." These charts illustrate the trend; you do not need to memorise their numbers. The deck also shows a short video ("Workday of a data scientist", Simplilearn) that is not part of the PDF.
Common confusion: data science is not the same as machine learning. On the Venn diagram, machine learning is computer science plus statistics without domain knowledge. Data science needs all three.
Exam note: a past practice exam (2024) asks: "One of the disciplines is the (human) domain expertise. What are the other two?" The answer is statistics and computer science. That exam labels the question "Blei and Smyth (2012)", but the paper on the slides is from 2017. If a year matters, use 2017.
In short: data science = computer science + statistics + domain knowledge, used to turn data into knowledge, plus the duty to understand context, handle data responsibly and communicate limits.
2. From data to wisdom
Plain definition. The lecture uses a pyramid from the knowledge discovery in databases (KDD) tradition (Fayyad et al., 1996; Fricke, 2009). It has four levels, each with a one-word tag:
Level
Tag
What the slide says
Data
Raw
Raw pieces of data
Information
Meaning
Data is useful, organized and structured
Knowledge
Context
Information is read, heard or seen, integrated and understood
Wisdom
Applied
Informed decision making
An arrow up the side lists the work that moves you upward: collecting (at the bottom), organizing, summarizing, analyzing, synthesizing (pulling things together), and finally decision making at the top.
Why it matters. It shows that the value is not in the raw numbers. Each step up needs a human or a method to add meaning, context and judgement. Collecting more raw data does not by itself move you up the ladder.
The lecture's football example. One moment in a match, described at each level:
Figure: The same moment in a football match, from raw coordinates to a decision.
Data: "Ball, player11, x=84, y=81". A tracking system logged who has the ball and where on the pitch, as coordinates. On its own, this means nothing to a coach.
Information: "The right winger has the ball at the corner of the penalty area." The coordinates are now organised and translated into football terms: who player 11 is and what x=84, y=81 means on the pitch.
Knowledge: "I am pretty close to the goal." The information is understood in context: from that spot, the goal is within reach.
Wisdom: "I better shoot on goal to score!" The knowledge is used to choose an action.
Notice that the coordinates alone could never tell you the best action. To climb you need extra context: the pitch layout, the match situation and the options the player has.
Correction: wisdom is not certainty. Being close to goal does not prove that shooting is the best option; a pass might be better. Wisdom means an informed decision, not a guaranteed one.
A second picture from the lecture. A cartoon (Somerville) titled "Getting value from the data" shows five panels: data (scattered empty dots), information (the dots coloured and sorted), knowledge (the dots connected into a network), insight (two particular dots lit up as the important ones), and wisdom (a highlighted path through the network linking them). It adds "insight" between knowledge and wisdom; the four-level pyramid is the version the slides label.
Illustration (health): a runner's watch measures her heart rate each morning.
Data: 51, 52, 53, 52, 51, 53, 52 beats per minute over the last 7 mornings, and 60 today.
Information: her 7-day average is 52 (the 7 numbers add up to 364; 364 ÷ 7 = 52), so today's 60 is 8 beats above her usual value (60 − 52 = 8).
Knowledge: she played a hard 90-minute match yesterday and slept 5 hours. A raised morning heart rate after that can mean she has not recovered yet (or is getting ill).
Wisdom: swap today's interval session for an easy one and check again tomorrow.
Exam angle: the classic trap is information vs knowledge. Information describes the situation ("the winger has the ball at the corner of the penalty area"). Knowledge understands what it means ("I am close to the goal"). Wisdom decides ("shoot!").
In short: data (raw) → information (meaning) → knowledge (context) → wisdom (applied decision); each step adds interpretation, not volume.
3. Kinds of data
3a. Structured vs unstructured
Plain definition.Structured data follow a fixed layout of rows and columns, the kind you find in a database or a tidy spreadsheet. Unstructured data have no such layout. They are "what you find in the wild": text, images, audio and video.
Why it matters. The kind of data decides how you store it, how hard it is to analyse, and which tools you need. Most of the world's data are unstructured and are hardly used.
Figure: Structured data fit rows and columns; unstructured data do not, but you can extract structured features from them.
The lecture shows four slides on this:
Growth (IDC chart). A chart from the International Data Corporation plots stored digital data from 1970 to the 2020s. Structured data ("well-defined, easily-organized database information") grow slowly. Unstructured data ("no data model") grow much faster and make up most of the total by the 2020s.
Picture. A neat grid of identical blocks ("what you find in a DB, typically") next to a messy mix of differently coloured blocks ("what you find in the wild: text, images, audio, video").
Comparison (Igneous). The table below. "Enterprise data" means all the data an organisation stores. Gartner is the technology research firm behind the estimates. "Legacy solutions" means older, standard storage and security software.
How much gets used (DalleMule & Davenport, 2017). Less than 50% of structured data is used in decision-making, and less than 1% of unstructured data is analysed at all. The slide asks you to think about which structured and unstructured data exist in sport and health.
Structured
Unstructured
Layout
Fits rows, columns and relational databases
Does not fit rows, columns or relational databases
Easier to manage and protect with legacy solutions
Harder to manage and protect with legacy solutions
Exam note: the Igneous graphic lists "spreadsheets" among unstructured file types, next to e-mails and word-processing files. This refers to loose office files rather than database tables. On the exam, decide by the rule the course uses: does the content sit in a fixed row-and-column layout? A tidy table with one row per athlete is structured.
Worked example (from past exams): the course's past exams ask this exact type of question.
A practitioner films patients with cerebral palsy (CP, a movement disorder caused by early brain damage) walking, and records each patient's CP type (one of four categories). The walking videos are unstructured; the CP type is structured (one value per patient in a column). This is answer C in the 2022–2023 test exam.
Ultrasound scans of rowers plus their VO₂max: the scan is unstructured (an image); VO₂max is structured (one number per athlete).
Unstructured in, structured out. You can turn unstructured data into structured data. A squat video is unstructured. If software measures the knee angle in each video frame, you get a table (frame 1: 172°, frame 2: 151°, …), and that table is structured. The video itself stays unstructured.
3b. Quantitative vs qualitative
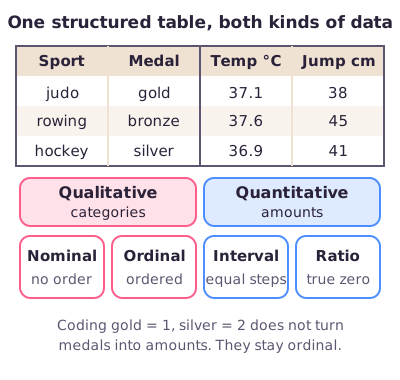
Plain definition.Quantitative data are amounts (time, jump height, heart rate). Qualitative data are categories (sport, injury type, medal colour).
Why it matters. This is a different question from structured vs unstructured. One structured table can hold both kinds of columns.
Figure: Sport and medal are categories; temperature and jump height are amounts. Each column also has a measurement scale.
Measurement scales (a preview; Lecture 4 covers them in full). The slide in this lecture only names quantitative and qualitative. Lecture 4 splits them further, and the 2022–2023 test exam asks about it, so here is the short version:
Scale
What you can say
Example
Nominal
Only "same or different"; no order
Sport: judo, rowing, hockey
Ordinal
Order, but steps are not equal
Medal: gold > silver > bronze
Interval
Equal steps, but zero is just a chosen point
Temperature in °C (20 °C is not "twice as hot" as 10 °C)
Ratio
Equal steps and a true zero, so "twice as much" makes sense
Jump height in cm (40 cm is twice 20 cm)
Nominal and ordinal are qualitative; interval and ratio are quantitative. The test exam's medal question (gold, silver or bronze) has the answer ordinal.
Correction: storing a category as a number does not make it an amount. If you code gold = 1, silver = 2, bronze = 3, the medals are still ordinal. "Silver minus gold = 1" means nothing.
3c. Who owns the data?
The lecture opens this topic with a cartoon from The Economist (2017) asking "Is data the new oil?". It shows oil rigs at sea labelled Amazon, Uber, Microsoft, Google, Facebook and Tesla. The message: data has become a raw material that big companies extract and profit from, the way oil companies pump oil.
Analogy: like crude oil, raw data is worth little until it is processed. Data science is the refinery.
A "Data in sports" slide then shows two headlines. One says data analytics is "a game changer" in sports and markets (CME Group, 2023). The other, "Sport Faces Big Data Dilemmas", warns of "significant risks, as well as rewards, in collecting detailed data on athletes' performances", and asks how intense the spotlight on professional athletes should be.
The lecture then poses a think–pair–share question (think alone, discuss with a neighbour, share with the class): who owns the right to collected data points? The slide gives no single answer. The athlete, the club, the device maker, an employer and a research institute can all have different rights and duties. Having access to data does not mean you are allowed to use it however you like. Ask what use is authorised and which privacy rules apply. The course reading by Chmait & Westerbeek (2021) expects such conflicts to grow, for example a team's injury-prediction model versus a player's right to their own data.
In short: structured = rows and columns; unstructured = video, images, audio, text (about 80% of data, under 1% analysed). Quantitative = amounts; qualitative = categories. These are two separate questions. Data ownership is a question to ask, not something to assume.
4. Data science in sport: four areas
Plain definition. The lecture groups examples of data science in sports research into four areas. It takes them from Chmait & Westerbeek (2021), a paper explaining AI and machine learning in sport to non-data-scientists.
Figure: The four areas and the examples the slide lists under each.
What each example means in plain words:
Game analytics.Match modelling: describing or predicting how a match unfolds or ends. Player tracking: following every player's position over time, from GPS or cameras. Sports technique classification: letting a computer recognise which technique was performed (for example, which tennis stroke). Event classification: labelling match events such as pass, shot or tackle.
Talent identification.Player recruitment: deciding which players to sign. Player performance measurement: putting numbers on how well someone plays. Biomechanics: the mechanics of movement (forces, joint angles, speeds).
Training & coaching.Assessment of team formation efficacy: checking whether a formation (for example 4-3-3) works. Training optimization: finding the training that gives the best result. Player injury modelling: estimating who is at risk of injury.
Fan & business focused.Ticket pricing: setting prices based on expected demand. Virtual or augmented reality: computer-generated or overlaid views for fans or training. Wearable optimization: improving devices worn on the body, such as heart-rate sensors.
Area
A question the data might answer
Game analytics
What happened in this match, and which patterns are useful?
Talent identification
Which characteristics relate to future performance?
Training & coaching
How do training and recovery relate to outcomes?
Fan & business
What do fans engage with, and how can services improve?
Correction: predicting, explaining and deciding are related but different goals. A model that predicts which player will get injured does not, by itself, tell you how to prevent the injury.
Exam note: the slide credits this list to "Chmait & Westerpoort 2021". The authors are actually Chmait & Westerbeek (2021), as the paper itself shows. Use "Westerbeek".
Exam angle: expect "which area does this example belong to?" For example, ticket pricing → fan & business; event classification → game analytics; player recruitment → talent identification; injury modelling → training & coaching.
In short: game analytics, talent identification, training & coaching, fan & business; know at least one example of each.
5. Data science, statistics and machine learning
5a. Data science vs statistics
Plain definition. The two fields are closely related, and data science is built on statistics. They share one goal: extracting knowledge from data. The lecture (using a comparison by Displayr) contrasts them like this:
Statistics
Data science
Age
Established field
Emerging field
Starting point
Starts with hypothesis testing
Starts with data: data mining, hypothesis generation
Best with
Limited data: few data points (for example few test subjects, or ethical limits on how many people you can test)
Lots of data, "long and wide", leaving room for exploration and discovery
Care needed
Deal with uncertainty; danger of drawing unfounded conclusions
Findings are not unequivocal, publishable results; the process does not stop with data science; danger of drawing unfounded conclusions
Typical background
Math or statistics
Engineering, multidisciplinary
"Long" data have many rows (many observations, such as 3 seasons of daily records). "Wide" data have many columns (many variables per observation). "Not unequivocal" means a data science finding can still be read more than one way, so it is not yet a firm result you could publish. Both columns say "requires carefulness and rigour": neither field is allowed to be sloppy.
The two phases of the scientific process. One slide (credited to Knobbe) puts the two fields in a single chain:
Figure: Data science generates the hypothesis from existing data; statistics tests it with new data.
Hypothesis generation (data science): dataset → analysis → hypothesis. You explore data you already have and spot a possible relationship. A coach is pretty happy at this stage: a useful pattern can already guide practice.
Hypothesis testing (statistics): hypothesis → collect new data → statistics. You state the claim in advance and test it on fresh data. A journal is only happy at this stage: science needs the claim confirmed.
Worked example:
Data you have: two seasons of sleep logs and recovery scores from your squad.
Generation: exploring them, you notice athletes with more irregular sleep seem to recover worse. That is a hypothesis, not a result.
Why not confirm it on the same data? You found the pattern by looking at many possible links. Illustration: if you check 50 different relationships and each has a 5% chance of looking "significant" (passing the usual statistical test) by pure luck, you expect about 2.5 false alarms (50 × 0.05 = 2.5). The sleep pattern might be one of them.
Testing: write down the hypothesis, collect new data (for example the next season, or a planned study), and test it with statistics.
Result: the coach could act on step 2 already, while staying cautious. A journal would only accept step 4.
Correction: this is a teaching contrast, not a strict rule. Statisticians also explore data, and data scientists also test hypotheses. In both settings you should report uncertainty and other possible explanations.
5b. Where AI and machine learning fit
Plain definition.Artificial intelligence (AI) is the broad field of making computers do tasks that seem to need intelligence. Machine learning (ML) is one area of AI (Chmait & Westerbeek, 2021). In classic analysis you give the computer rules plus data and it gives answers. In machine learning you give it data plus the known answers, it works out the rules itself, and you then check those rules on new, unseen data.
Figure: Machine learning sits inside AI; data science is the whole project and uses statistics and machine learning as tools.
How the words relate:
On the Venn diagram (section 1), machine learning is computer science + statistics without domain knowledge.
Data science is the whole project, from the question to the advice. It uses statistics and machine learning as tools, mainly in the modelling step, and adds domain knowledge and communication.
The course's lecture list names the main ML types you will meet. Supervised machine learning has known answers in the training data: regression (predict a number) and classification (predict a category). Unsupervised machine learning has no answers: clustering (find groups). Later lectures also cover neural networks (a flexible kind of ML model loosely inspired by the brain).
Illustration: a club wants to predict injuries. Statistics helps judge whether a link between training load and injury is real or noise. Machine learning learns a prediction rule from past seasons in which you know who got injured. Data science is the whole job: agreeing on the question with the medical staff, getting and cleaning the data, building and checking the model, and explaining its limits to the coach.
In short: statistics tests ideas carefully; data science explores big data to find ideas (a coach is happy) that statistics then tests on new data (a journal is happy). Machine learning is one area of AI and one tool inside a data science project.
6. The data science lifecycle
Plain definition. The data science lifecycle is the series of nine steps every data science project goes through. The lecture draws it as a loop, because results often send you back to an earlier step.
Figure: The nine steps. Preparation comes before exploration.
Why it matters. It is the backbone of the course. The course aims say the focus is "recognizing and implementing all steps of the data science lifecycle in practice". Your three assignments follow it: the proposal plans all the steps, the report carries them out, and the presentation communicates them (see section 9).
What happens at each step, with one sport project.Illustration: a running coach wants to predict each runner's next 10 km race time to plan race targets.
Step
What happens
In the running project
1. Identify the (business) problem
Define the purpose, the user and the target; ask why it matters
Predict next 10 km time (in seconds) to help the coach plan
2. Data acquisition
Get suitable data from its sources
Export past sessions from the watch platform; collect race results
3. Data preparation
Clean: fix formats and units, remove duplicates, handle missing values
Convert all paces to seconds per km; delete double-uploaded runs
4. Data exploration
First summaries and plots of distributions and relationships (also called exploratory data analysis)
Plot weekly distance against race time; check odd values
5. Feature engineering
Build informative model inputs from raw data
Average weekly distance over the 6 weeks before each race
6. Data modelling
Fit a suitable method
A regression model that predicts time in seconds
7. Data visualization
Show data and results clearly
Plot predicted against actual race times
8. Present & communicate
Explain findings, limits and advice
Tell the coach the typical error and when not to trust a prediction
9. Deployment & maintenance
Put the result into use and keep checking it
Update predictions monthly; check accuracy as runners change
Loop back. Say the exploration plot (step 4) shows some race times of 10 seconds. That is a data error, so you go back to preparation (step 3). Or the model in step 6 is poor, so you return to feature engineering (step 5) or even to acquisition (step 2) for more data.
Exam angle:
Order. The lecture's order is: identify the problem → acquisition → preparation → exploration → feature engineering → modelling → visualization → present & communicate → deployment & maintenance. The common mistake is putting exploration before preparation.
Place an activity in a step. The 2022–2023 test exam asks which step R's str() belongs to (str() prints a quick overview of a dataset's columns and types). The answer is data exploration. Making a chart with ggplot() (R's main plotting function) is data visualization.
Model answer from that test exam (open question). It lists the nine steps in this order. It adds that talking to domain experts matters in many steps, such as data acquisition and presenting and communicating. It also says most of a project's time goes into defining the business problem and designing the analysis.
Correction: a lifecycle step is not an algorithm. Regression is a modelling approach (step 6). Cleaning wrong heights is preparation (step 3). Explaining a prediction to a coach is communication (step 8).
Exam note: the slides use slightly different labels for the same steps: "Identify the (business) problem" and "Business problem"; "Present & communicate" and "Presentation & communication"; "Data exploration (exploratory data analysis)". These are the same nine steps.
In short: nine steps in a loop, with preparation before exploration; know what happens in each step and be able to place any activity in its step.
7. Step 1 in detail: identify the problem
Plain definition. Before touching data, work out what the person asking really needs. The slide calls it the "(business) problem": the practical need of whoever asked, such as a coach, a club or a clinic. Under "Identify project objective" the slide lists:
It is critical to understand the business problem.
Determine which questions you are asking and how answering them achieves the goal.
Keep asking why.
Specify the key target variables that answer your questions.
Why it matters. A vague goal leads to a useless project. "Use AI" is not an objective. "Estimate each player's hamstring injury risk for the next four weeks, from data available today" is. Even then you still have to check that it is feasible.
Talk to domain experts: the Golden Circle. The second slide on step 1 says "Talk to domain experts" and shows the Golden Circle: three rings with WHY in the middle, HOW around it and WHAT on the outside. Its text says every organisation knows what it does (its products or services). Some know how they do it (what makes them special). Very few know why they do it: their purpose or reason to exist, which is not about making money. Applied to a project: start from the why, then the how and what follow.
Illustration (keep asking why):
Coach: "I want an AI tool for our GPS data." Why?
"To lower injuries." Why that?
"We lost six players to hamstring injuries last season." Why does that matter now?
"Our two strikers are missing the playoffs."
Real question: which players are at high risk of a hamstring injury in the next four weeks? Target variable: hamstring injury yes/no in the next four weeks. That is a "which category?" question, so classification.
The five typical questions. The slide ends with five typical data science questions, each linked to an approach:
Figure: Match the wording of the question to the approach.
Question
Approach
Sport/health example
How much or how many?
Regression
How many weeks until this athlete returns to play?
Which category?
Classification
Will this player be injured: yes or no?
Which group?
Clustering
Which groups of similar fans does the club have?
Is this weird?
Anomaly detection
Is today's resting heart rate unusual for her?
Which option should be taken?
Recommendation
Which of three training plans should she follow?
Common confusion: classification vs clustering. In classification the categories are known in advance (injured/not injured) and you assign new cases to them. In clustering nobody gives you the groups; the method finds them.
Exam angle: questions give a practitioner's request and ask for the approach. Look for the key words: a number → regression; a known label → classification; finding groups → clustering; unusual → anomaly detection; choosing an option → recommendation.
In short: understand the problem, talk to domain experts, keep asking why, name the target variable, then let the question's wording pick the approach.
8. Tools: R, RStudio and DataCamp
R. The slide defines R as "a programming environment and language made specifically for graphical applications and statistical computations".
Advantages (+)
Disadvantages (−)
Free and open source (the code is public and free to reuse)
Slow computation with large datasets
Large community of users
Many packages with the same functionality ("many ways to Rome")
Cutting-edge technology
Visualizations and statistics
Popular in academia, used in many industries
"Many ways to Rome" means there are several packages that do the same job, which can confuse beginners.
Environments. The lecture compares three places to write R or similar code:
The plain R console looks like a computer terminal: you type one command and get the answer.
Matlab is shown as another (commercial) programming environment for comparison.
RStudio is an IDE with four panes: 1. code editor (write and save scripts), 2. R console (runs commands and shows output), 3. workspace & history (the objects you have created and the commands you ran), 4. plots & files (charts, files, help and packages).
Illustration:
heights <- c(1.82, 1.75, 1.90)   # store three heights in metres
mean(heights)                      # average height
# [1] 1.823333
You type this in the code editor (pane 1) and run it. The answer appears in the console (pane 2). The new object heights appears in the workspace pane (pane 3). If you drew a plot, it would show in pane 4. The mean is (1.82 + 1.75 + 1.90) ÷ 3 = 5.47 ÷ 3 ≈ 1.823 m.
Exam angle: "Where do you see which objects you have created so far?" → workspace & history (pane 3), not the console.
DataCamp and help.DataCamp is the online learning environment for R in this course. Its screen has the assignment instructions, a code editor and an R console. Its modules run in parallel with Assignment 2 (see section 9). Stack Overflow is a question-and-answer website where the programming community helps with specific problems. You are still responsible for understanding any solution you copy. Python is the other big data science language; job adverts ask for "Python or R", and this course uses R.
In short: R is free, strong in statistics and graphics, but can be slow on big data and has many overlapping packages. RStudio panes: code editor, console, workspace & history, plots & files.
9. Course admin (not exam content)
This section records what the Lecture 1 slides say about the course. Check Canvas and the course manual for current logistics; these notes are for learning the content.
Aims. Gain knowledge about data science; learn a new programming language; learn to apply data science techniques; learn to communicate findings as well-supported advice to athletes, trainers, coaches and health professionals; prepare for a job in industry. The focus is recognising and carrying out all steps of the data science lifecycle in practice. The slides call the course "a fair introduction" because the field is too broad to cover fully.
Structure. 9 lectures (including guest lectures), 6 practical labs (including programming in R), and 1 seminar group presentation. Course information sits on Canvas, in the course manual, and in the lectures, practicals, seminar groups, assignments and literature (preparation).
Lecture topics listed: introduction to data science; basics of programming in R (laptop required); data pre-processing, exploration and visualization; data in sport and health; supervised machine learning: regression; supervised machine learning: classification; unsupervised machine learning: clustering; machine learning: neural networks; big epidemiologic data approaches; user-generated data. The slide lists ten topic lines under "9 lectures", so some topics share a session.
People. Instructors: Dr. Artem Belopolskiy and Dr. Marco Hoozemans. Also on the teaching team: Aske Gye Larsen, Jim van 't Schip, Lucas Jansen and Yves Persijn. Guest lecturers: Aisha Ndiaye and Marco Altini. Contact: data-science-1.fgb@vu.nl.
Assignments (they follow the lifecycle).
Assignment
Task
Deadline on slide
1. Proposal
Describe how you will answer the practitioner's (research) question using all steps of the lifecycle
15 Sept
2. Report
Describe the data analysis you carried out to answer the question, in line with your proposal
13 Oct
3. Presentation
Advice to practitioners: present your proposal and the analysis you did
16 Oct
Make groups of 6 and register on Canvas (first come, first served). The deck also lists lab practical dates and rooms per group (2 September to 6 October).
Seminars (obligatory). Eight sessions where groups present Assignment 3:
13 Oct, 11:00–12:45: groups 1–4 (Artem & Lucas)
13 Oct, 13:30–15:15: groups 5–8 (Artem & Lucas)
13 Oct, 15:30–17:15: groups 9–12 (Artem & Lucas)
13 Oct, 17:30–19:15: groups 13–16 (Aske & Jim)
15 Oct, 09:00–10:45: groups 17–20 (Aske & Jim)
15 Oct, 11:00–12:45: groups 21–24 (Aske & Jim)
15 Oct, 13:30–15:15: groups 25–28 (Marco & Yves)
15 Oct, 15:30–17:15: groups 29–32 (Marco & Yves)
DataCamp modules alongside Assignment 2. Basics in R; 2a data import & processing ↔ data import & dplyr (an R package for handling data tables); 2b data visualization ↔ ggplot2 & exploratory data analysis; 2c statistics and modelling ↔ missing data, statistics, ML; 2d modelling, wrap-up and Q&A.
Generative AI rules. "Coding is a craft — you need to learn it yourself."
Learn to code, not just to generate code.
AI can be your assistant for explanations, ideas or help when stuck (for example ChatGPT or Copilot).
Do not blindly copy-paste: AI-generated code can be wrong, inefficient or unsuitable.
Understand everything you submit: you are responsible for every line of code and text, and must be able to explain and reproduce it.
Be transparent: the Assignment 2 report needs a Generative AI statement saying which tools you used, where, and how they helped.
Rule of thumb: use AI to help you learn and solve problems, not to replace the learning.
To do after Lecture 1 (from the slide). Sign up for a group on Canvas; bring a laptop with R installed to the next day's session; check Canvas and rooster.vu.nl for when and where your group meets.
Common confusions
Data science vs machine learning: machine learning is computer science + statistics; data science also needs domain knowledge and covers the whole lifecycle.
Information vs knowledge: information describes ("winger has the ball at the corner of the penalty area"); knowledge understands it in context ("I am close to the goal").
Structured/unstructured vs quantitative/qualitative: the first is about layout (rows and columns or not), the second about what the values mean (amounts or categories). A structured table can hold both.
Category stored as a number vs a real amount: medal coded 1/2/3 is still ordinal; you cannot do arithmetic with it.
Hypothesis generation vs hypothesis testing: finding a pattern in existing data is not the same as confirming it with new data.
Data preparation vs data exploration: preparation (cleaning) comes first; exploration (summaries, plots, str()) comes second.
Lifecycle step vs method: regression is a method used in the modelling step; it is not a step itself.
Classification vs clustering: classification uses known categories; clustering discovers groups.
More data vs better data: volume says nothing about quality, usefulness or permission to use it.
Prediction vs prevention: predicting an injury does not tell you how to prevent it.
Slide coverage map
PDF pages 1–6: title and teaching staff.
7–33: course aims, organisation, lectures, assignments and deadlines, groups, seminars, R/RStudio/DataCamp/Stack Overflow, generative AI rules, grading (sections 8–9).
34–42: data as "the new oil", data in sport, structured vs unstructured, quantitative vs qualitative, data ownership (section 3).
43–51: definition of data science, data-to-wisdom pyramid, Blei & Smyth, Venn diagram (sections 1–2).
52: four areas of data science in sport (section 4).
53–55: data science vs statistics and the two phases (section 5).
56–61: "sexiest job", data scientist skills and job listings (section 1).
62–68: workday video, the lifecycle, problem identification, Golden Circle, five typical questions (sections 6–7).
69: to-do list (section 9).
Worked through the deep dive?Tick it off. Come back to any section whenever you need it.
3Step 3 of 35–8 min
Practice questions
2 exam-style questions. Exam-style open questions: short, with the points shown like on the real exam. Write your answer in the box, then check it against the model answer and the marking guide.
Question 1 — The three disciplines of data science (2 points)
A research team can process millions of GPS records and fit an accurate model, but its advice to the coach ignores football tactics. State and motivate briefly: 1) Name the three disciplines that overlap in data science. 2) Which discipline is missing in this team, and what does the lecture's Venn diagram call the overlap of the two disciplines the team does have?
Show answer and rationale
1) Computer science/IT, math and statistics, and domain (business) knowledge.
2) Domain knowledge is missing: nobody checks whether the advice makes sense for football tactics. Computer science + statistics without domain knowledge is called machine learning.
How the points are earned
1 pt Three disciplines: computer science/IT, math/statistics, domain knowledge
1 pt Domain knowledge is missing (0.5); the overlap is machine learning (0.5)
How did your answer compare?
Question 2 — Data science lifecycle (3 points)
A physiotherapist wants a tool that estimates next week's completion of home exercises from earlier rehabilitation records. State and motivate briefly: 1) Name four steps of the data science lifecycle in the correct order, with one concrete action for this project at each step. 2) Explain why the work is not finished once the model works.
Show answer and rationale
1) Example: identify the problem (define 'completion' and the decision the physio will base on it) → data acquisition (export past rehabilitation records) → data preparation (fix units, remove duplicates, handle missing values) → data modelling (fit a model that predicts next week's completion). Exploration, feature engineering, visualization and communication are also valid, as long as the order follows the lifecycle.
2) The result still has to be presented to the physio with its limits, and then deployed and maintained: patients and records change, so the predictions must be checked and updated over time.
How the points are earned
1 pt Four lifecycle steps named in the lecture's order
1 pt A fitting, concrete action for each named step
1 pt After modelling: communicate results and limits, deploy and maintain (monitor, update)